Enrollment Data
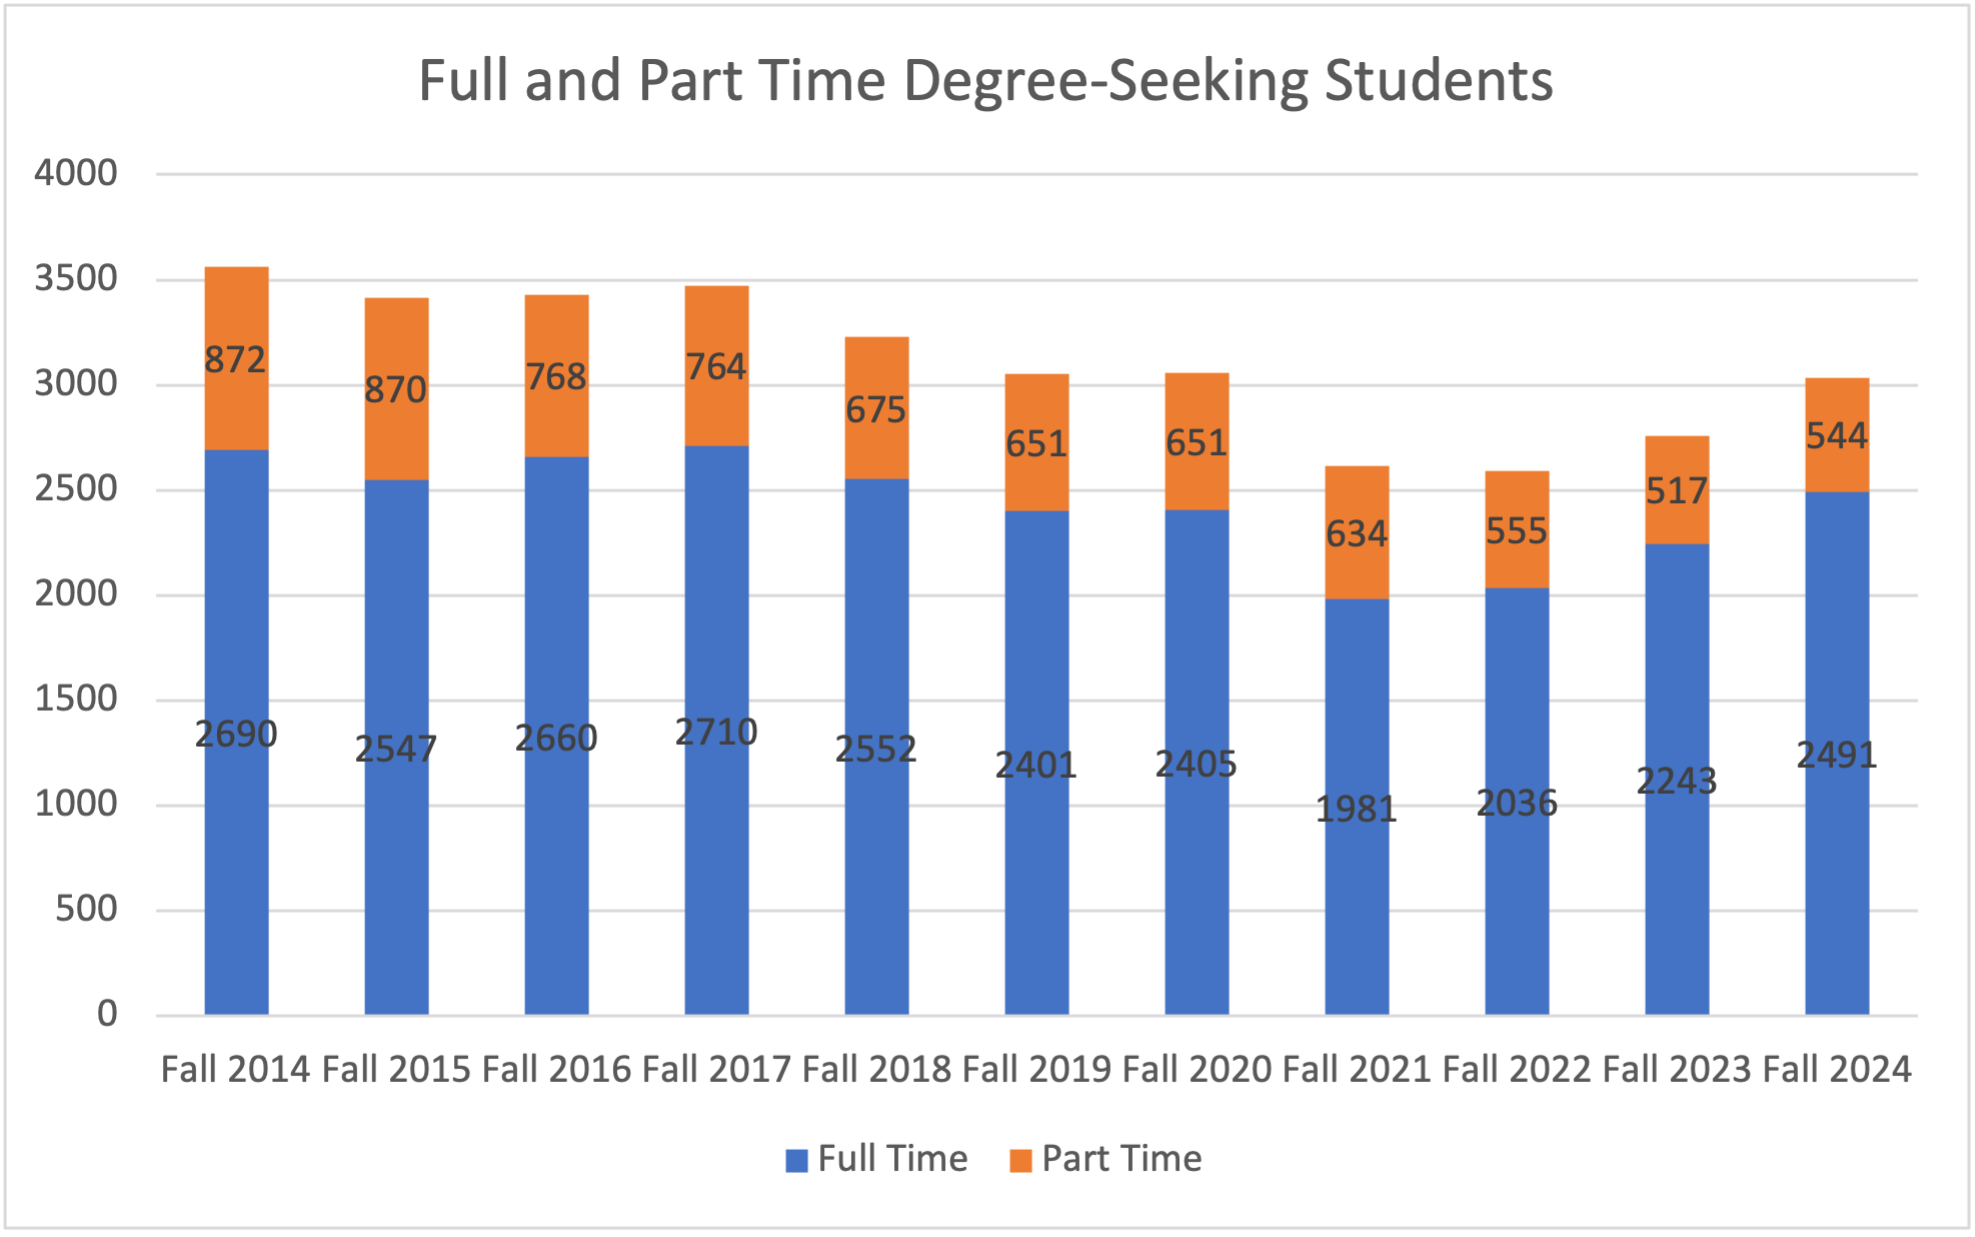
Trends in Full & Part-Time Enrollment of Degree-Seeking Students
| Fall 2014 | Fall 2015 | Fall 2016 | Fall 2017 | Fall 2018 | Fall 2019 | Fall 2020 | Fall 2021 | Fall 2022 | Fall 2023 | Fall 2044 | |
|---|---|---|---|---|---|---|---|---|---|---|---|
|
Full Time |
2690 |
2547 |
2660 |
2710 |
2552 |
2401 |
2405 |
1981 |
2036 |
2243 |
2491 |
|
Part Time |
872 |
870 |
768 |
764 |
675 |
651 |
651 |
634 |
555 |
517 |
544 |
|
Total |
3562 |
3417 |
3428 |
3474 |
3227 |
3052 |
3056 |
2615 |
2591 |
2760 |
3035 |
|
FTE |
2981 |
2837 |
2916 |
2965 |
2777 |
2618 |
2622 |
2192 |
2221 |
2415 |
2672 |
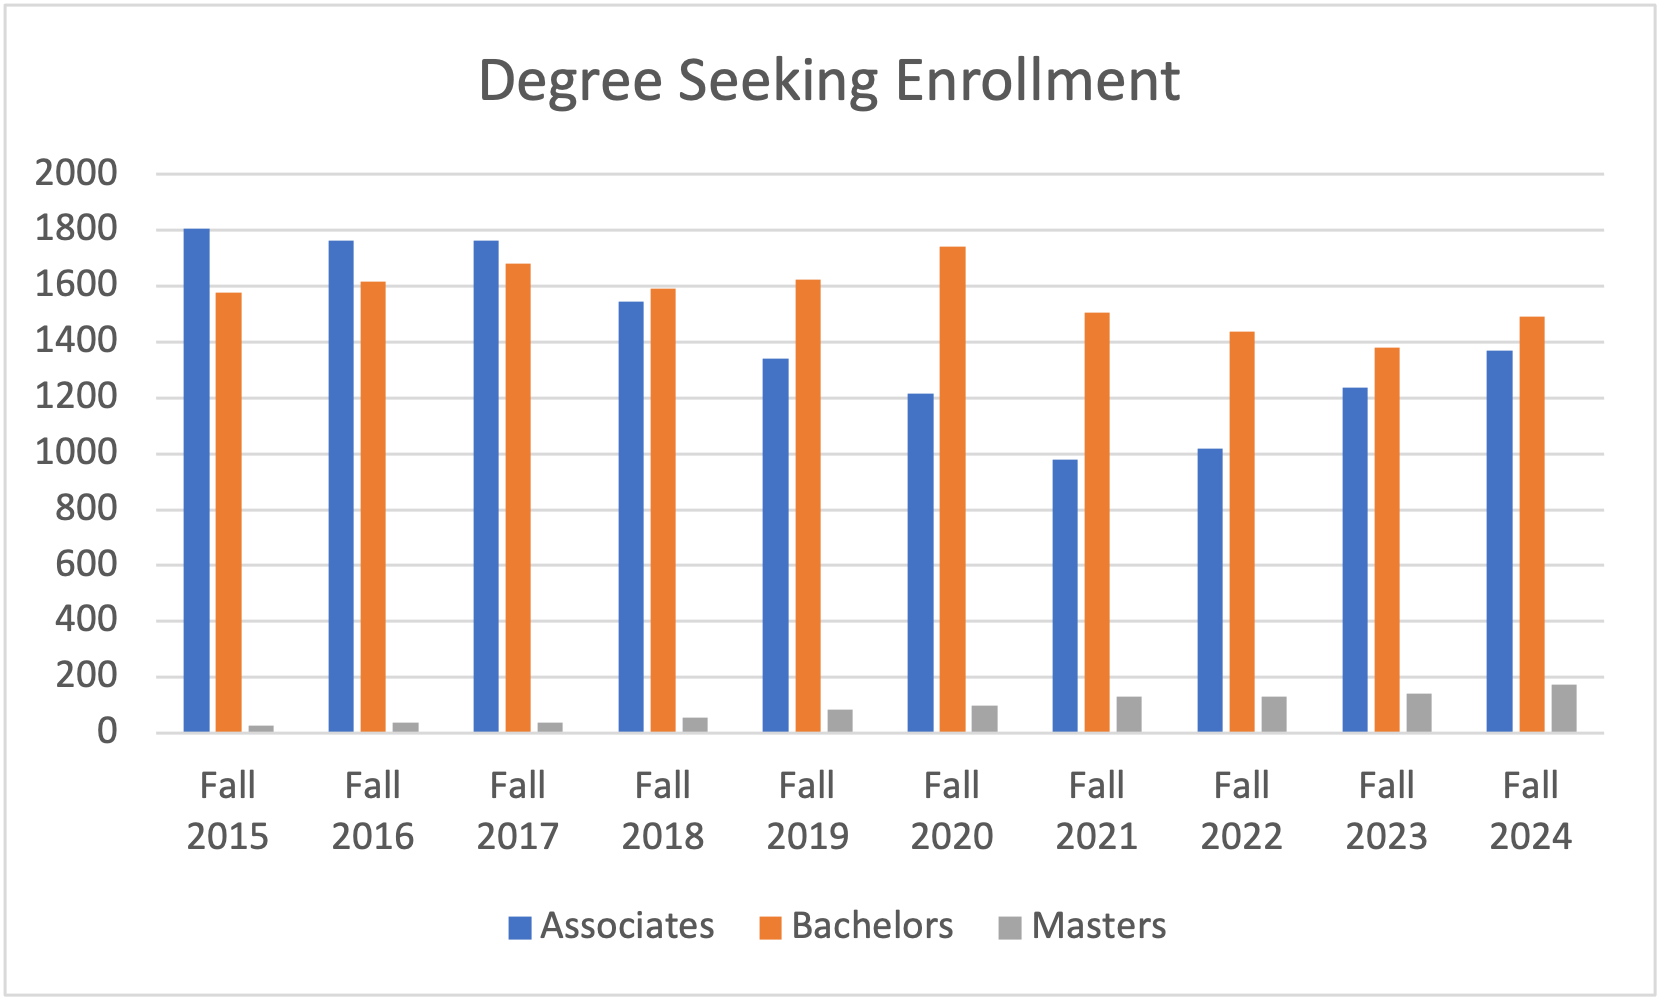
Trends in Enrollment by Degree Type
| Fall 2015 | Fall 2016 | Fall 2017 | Fall 2018 | Fall 2019 | Fall 2020 | Fall 2021 | Fall 2022 | Fall 2023 | Fall 2044 | |
|---|---|---|---|---|---|---|---|---|---|---|
|
Associates |
1805 |
1764 |
1764 |
1544 |
1342 |
1214 |
978 |
1017 |
1238 |
1369 |
|
Bachelors |
1578 |
1616 |
1681 |
1593 |
1624 |
1741 |
1506 |
1439 |
1380 |
1491 |
|
Masters |
26 |
37 |
39 |
55 |
85 |
100 |
129 |
132 |
142 |
174 |
|
Certificate |
8 |
11 |
8 |
5 |
1 |
1 |
2 |
1 |
0 |
0 |
|
Graduate Certificate |
0 |
0 |
0 |
0 |
0 |
0 |
0 |
2 |
0 |
1 |
Summary of Trends
These data track degree seeking student enrollment for Fall semesters between Fall 2014 and Fall 2024; both undergraduate and graduate students are included. Non-matriculated students are excluded. The data table also includes the FTE figures, which stands for “Full-Time Equivalent” and is calculated based on both full-time and part-time enrollment. Overall enrollment peaked in the Fall 2014 term, and while decreasing slightly over the next three years, remained fairly constant until the Fall 2017 term. While remaining steady, there were declining figures through Fall 2020 after which the COVID pandemic greatly affected enrollment numbers. Enrollment has since increased, climbing steadily higher for the past two years.